Fishing for wait types revisited – QUERY_TASK_ENQUEUE_MUTEX

This post comes with a generous serving of humble pie. Many months ago I did a write-up about using Windbg to search for likely occurences of wait types within SQL Server modules, taking advantage of the fact that the wait type tends to show up “hard-coded” within a parameter assignment before the call to a wait function – see Fishing for wait types in WinDbg.

Now I must admit I have only sporadically used that technique, but I had some degree of faith in it. So far the only wait type I have encountered that doesn’t show up so obviously is THREADPOOL, a.k.a. SOS_WORKER. This is simply because there is a static SOS_WaitInfo structure for it, and hence we see the address of that structure referenced, i.e. a level of indirection that takes the magic number out of the code.

So last week my ears pricked up – or more accurately, were pulled in the right direction by Randolph West ( b | t ) when Joe Obbish wrote about the QUERY_TASK_ENQUEUE_MUTEX wait encountered during his adventures with The Trillion Row Table.

Trying to find out something about obscure wait types is always an irresistible diversion, and judging by the comments, David Williams ( b | t ) thought the same. Unfortunately I was away from home and SQL Server for a few days, but I figured it would take me a hour at the weekend to find something interesting.

Wherein our hero whips his own stupid ass

Ha! Cracking open Windbg on 2016 SP1 with the s command to look for byte patterns yielded nothing of value. Maybe something has changed with conventions or indirection? Nope, no joy in 2014 either.

In the end, it took the extremely brave step of RTFM, in this case the Windbg online help, to realise where I was going wrong. I was searching for a four-byte pattern by searching for doublewords. Sounds reasonable on the face of it, but what I had missed was that this specifically required the doublewords to be doubleword-aligned, i.e. starting on an address divisible by four. My method only had a 25% chance of working, so it’s sheer luck I ever got good results with it.

Changing to a byte search for four consecutive bytes gave me the non-aligned semantics my taste buds craved, and the results came pouring in.

Worked example

So I am not going to try and say too much about the wait type yet, but I may as well use the opportunity to show the process of finding occurrences in code. Main thing to remember is that searching for four consecutive bytes, rather than a doubleword, requires you to reverse the order of the bytes, i.e. express it explicitly as little endian.

sys.dm_xe_map_values tells us that QUERY_TASK_ENQUEUE_MUTEX has an index (“map_key”) of 719 in 2016 SP1; this translates to 0x02cf in hexadecimal. We’ll be looking for doublewords with one bit set in the most significant word, and 0x02cf in the least significant word, i.e.

0x000102cf
0x000202cf
0x000402cf
0x000802cf
0x001002cf
0x002002cf
etc...

This translates to byte-reversed four byte patterns like cf 02 01 00, cf 02 02 00 etc. Let’s give it a whirl and look in sqlmin. First get the module starting address and length, using Windbg as a hex calculator. Your results will vary.

0:085> lm m sqlmin
start             end                 module name
00007ff9`e6d80000 00007ff9`e924b000   sqlmin     (pdb symbols)          C:\Program Files (x86)\Windows Kits\10\Debuggers\x64\sym\sqlmin.pdb\D38058F49E7C4D62970677E4315F1F1C2\sqlmin.pdb
0:085> ? 7ff9`e924b000 - 7ff9`e6d80000
Evaluate expression: 38580224 = 00000000`024cb000

Cool, now I know that sqlmin occupies 0x024cb000 bytes starting at 0x7ff9`e6d80000. Time to go fishin’.

0:085> s -b 0x7ff9`e6d80000 l0x024cb000 cf 01 40 00

Nada. Move up a bit.

0:085> s -b 0x7ff9`e6d80000 l0x024cb000 cf 02 40 00
00007ff9`e6eca58d  cf 02 40 00 49 8d 8b a0-fb ff ff e8 13 7a 09 00  ..@.I........z..
00007ff9`e76c463b  cf 02 40 00 48 8d 4c 24-28 e8 67 d9 89 ff 48 8b  ..@.H.L$(.g...H.
00007ff9`e7bb8d49  cf 02 40 00 4c 89 65 38-4c 89 65 48 4c 89 65 40  ..@.L.e8L.eHL.e@

Holy carp, the sqlmin are spawning! I’d be scared to meet anyone who can sight-read those byte patterns, but we have addresses that might lie within functions of interest. Let’s see what happens there; long boring assembly dumps reduced to function names:

0:085> uf 7ff9`e6eca58d
sqlmin!CQScanExchangeNew::StartAllProducers
...
0:085> uf 7ff9`e7bb8d49
sqlmin!CBpQScanColumnStoreScan::InitRowsetColumnBatch
...
0:085> uf 7ff9`e76c463b
sqlmin!CXRowset::GetXact
...

Okay, so to prove the point, here is how the wait call manifests in the first function:

00007ff9`e6eca58c bacf024000      mov     edx,4002CFh
00007ff9`e6eca591 498d8ba0fbffff  lea     rcx,[r11-460h]
00007ff9`e6eca598 e8137a0900      call    sqlmin!TAutoMutex<SOS_Mutex,1>::GetAccess (00007ff9`e6f61fb0)

This uses a template TAutoMutex, which wraps a plain old SOS_Mutex as a convenience. Merely instantiating the TAutoMutex as a local variable means that the developer gets mutex acquisition and release for free through variable scoping. Of course, how the mutex works internally is far less interesting than what it protects.

A bird’s-eye view of the functions

Disclaimer time. I am not pretending to be dropping a proper explanation about the blocking scenario that Joe came up against. I only speak three words of Columnstore, and two of them are unprintable, so I lack domain expertise. But I do take quite an interest in things that enqueue tasks, and someone else might be able to make meaningful observations from the below.

From the name of the wait type alone, we can’t tell which of the three functions was the likely blocker and which was the likely blockee. They could well have been two instances of the same function. So let’s just list out which calls each does while holding the mutex – the blocking is certain to sit in a child function, since nothing in these functions by themselves is heavyweight. A cursory glance also doesn’t tell us whether or not the mutex sits in a structure of which a single one gets shared across the workers, but we may as well assume there is only one going around.

CWRowset::GetXact is short and sweet. Get the mutex, call CQueryInstance::AddSubXact, and release the mutex.

CQScanExchangeNew::StartAllProducers is a lot more meaty. Here are the functions called, and spinlocks held briefly, while holding the mutex:

  • CXPort::StartNestedTransactions
  • SUBPDESC_LIST spinlock
  • CQScanExchangeNew::PxproddescCreate within a loop
  • QUERYSCAN spinlock
  • SubprocessMgr::EnqueueMultipleSubprocesses – this is getting close to my main area of interest, and something I will definitely explore in depth down the line!
  • CSpinEventMutex::GetAccess – another one for my to-do list
  • SPIN_EVENT_MUTEX spinlock – yup, you only get to try this after already having access to the preceding item
  • SubprocessMgr::GetFirstSubprocDesc and GetNextSubprocDesc – much of this is in a loop, so we’re iterating over subprocesses
  • SUBPDESC spinlock

CBpQScanColumnStoreScan::InitRowsetColumnBatch is equally meaty, although a far smaller part of it runs while holding the mutex of interest – here are the calls within that portion:

  • A function pointer call I have yet to identify (sorry, limitation of static analysis!)
  • optionally, HkNestedTransactionAlloc
  • CQueryInstance::AddSubXact
  • Another indirect call on a function pointer, but only if that pointer isn’t CQte::NidGet. Hand up if you know what a Nid is šŸ˜‰
  • CBpQScanColumnsStoreScan::SetupSubSegmentScan
    • So all in all, in hand-wavey broad strokes you get a picture of something involving parallel tasks, nested transactions, and sub-segments. Seems safe to say that we are in Joe’s sand box.

      Now if only I can stop thinking about getting myself a Nid for Christmas…

The DMV Diaries: sys.dm_os_workers

Following hot on the heels of sys.dm_os_threads, today we look into the worker objects built on top of them. This is intended to be supplementary to the official documentation on sys.dm_os_workers, so I’ll comment on that where appropriate, rather than repeating it. My reference version is 2016 SP1.

Basic plumbing of related objects

worker_address is of course simply the address of the Worker class instance we’re looking at. It is bound to the SOS_Scheduler living at scheduler_address and (once out of the SystemThreadDispatcher) to the SystemThread class instance at thread_address.

Once bound to an SOS_Task in the owning scheduler’s WorkDispatcher, it will expose that object’s address in task_address.

If we’re running in fiber mode, fiber_address points to the fiber data containing the user-mode thread state.

Now this isn’t intended to be about memory, but memory issues tend to touch everything we look at anyway, so a short diversion is in order.

We saw in my previous post on sys.dm_os_threads that each thread gets an associated MiniSOSThreadResources object which already contains a worker. Beyond that initial thread bootstrapping though, the factory method Worker::CreateWorker() is called to create useful Workers. One of the first things that function does is to allocate the memory (2816 bytes) in which to construct the Worker instance. This memory is provided by a memory object which is specially created for the occasion, and the pointer to the memory object is stored within the Worker; this is what gets exposed as memory_object_address.

What’s interesting in the memory hierarchy is that this is a memory object which both “belongs” to the Worker and is its parent. It is possible for other objects and functions to milk it for further “worker-local” allocations, although that would be an exploration for another day.

State and status

The state enum is a familiar one; here are its integer values:

0 - Init
1 - Running
2 - Runnable
3 - Suspended

As described in The DMV diaries: Task, Request and Session State, the value exposed in the DMV lacks the layered semantics of e.g. task state. Once we go beyond Init, we simply see how the SQLOS scheduler views the worker when in nonpreemptive mode. If the worker is running, it owns the scheduler. If runnable it is owned by the scheduler’s runnable queue. And if suspended, the scheduler doesn’t have any interest in its movement, unless the worker is waiting on IO or a timer.

status is an interesting one, and is the source of a bunch of the following is_xxx flags, which break out its individual bits.

Here is the 0-based bit mapping of the flags exposed in the DMV, plus a handful of others I know to be in use but aren’t exposed here.

bit  2 - is_preemptive
bit  3 - is_fiber
bit  4 - is_sick
bit  5 - is_in_cc_exception
bit  6 - is_fatal_exception
bit  7 - is_inside_catch
bit  8 - also involved in exception state
bit 11 - used in scheduling
bit 12 - lazy preemptive (in conjunction with 2)
bit 13 - is_in_polling_io_completion_routine
bit 19 - set in SOS_Task::DoomThread() 

There is a second bitmask member in the Worker class, containing flags like “do not suspend”, “is in external code”, “is in exception backout” etc. For whatever reason, the DMV authors didn’t expose any of these flags.

I/O, exception and affinity metrics

pending_io_count is a straightforward member of the Worker instance, as is pending_io_byte_count. And pending_io_byte_average is simply a convenience column derived from the other two, saving you from having to special-case around potential division by zero.

It is possible for exception_num to be either a 16-bit or 32-bit integer; which it is is determined by another flag elsewhere in the worker. exception_severity lives within the worker, but additional information like exception state is found in a separate ExceptionInfo struct, which is the thing pointed to by exception_address.

affinity comes straight from a Worker member, whereas processor_group is derived from an embedded NodeAffinity instance.

Timestamps

Time to talk about time again. Within SQLOS, the vast majority of “Now()” time stamps are stored as integers sourced from one of two domains. Which domain gets used is determined at service startup and – to the best of my knowledge – will not change until shutdown. The two option are:

  1. The QueryPerformanceCounter (QPC), used if an invariant timestamp is available. This is the more predictable and finely grained option, and I’d assume that it applies on most serious systems.
  2. As fallback, timer interrupt ticks can be used. These are very easy and cheap to retrieve from the KUSER_SHARED_DATA structure, but resolution is at the mercy of outside forces, and can be as bad as 15.6ms.

I have previously touched on the two options when discussing the source of getdate() in Milliseconds 10, ticks 3.

So to get to the point, all the below columns expose normalised values, derived either by applying the instance-specific SOS_PublicGlobals:sm_QueryPerformanceFrequencyBase (QPC) or a simple constant factor of 10,000 (interrupt ticks) to the underlying properties:

  • worker_created_ms_ticks
  • task_bound_ms_ticks
  • wait_started_ms_ticks
  • wait_resumed_ms_ticks
  • start_quantum
  • quantum_used
  • max_quantum

Here are a few notes to pad out the official documentation.

wait_started_ms_ticks is set in SOS_Task::PreWait(), i.e. just before actually suspending, and again cleared in SOS_Task::PostWait(). For more about the choreography of suspending, see here.

wait_resumed_ms_ticks is set in SOS_Scheduler::PrepareWorkerForResume(), itself called by the mysteriously named but highly popular SOS_Scheduler::ResumeNoCuzz().

start_quantum is set for the Resuming and InstantResuming case within SOS_Scheduler::TaskTransition(), called by SOS_Scheduler::Switch() as the worker is woken up after a wait.

max_quantum is a high-water mark for the longest time the worker has spent on a single quantum, and quantum_used is the total time the worker has spent in the Running state.

Definitely the most interesting one of the bunch is end_quantum. This is a calculated field, and is simply start_quantum plus the scheduler’s quantum length, which is currently always 4ms.

What makes it interesting is that this calculation is redundant with the quantum target actually stored as a property within the Worker. This has been touched on recently by Paul Randal in a great thought-provoking blog post when he mentioned that the quantum end is stored in RDTSC ticks.

My best guess is that RDTSC came to the fore here for the sake of fine grain and very low cost. Even in the face of clock speed changes, having a bit of variation in the quantum end is probably no big deal, compared with the risk of having to use interrupt ticks with a dodgy or completely unusable accuracy. And on the cost front, the classic “is it time to yield yet?” check is really cheap to express when it’s just a case of pulling up the current TSC and comparing it with the precalculated finish line.

Anyhow, when calculating end_quantum for the DMV, we get the additional conversion joy of leaning on SOS_PublicGlobals::sm_CpuTicksPerMillisecond, because the quantum length (at scheduler level) is expressed in CPU ticks.

Odds and ends

last_wait_type, tasks_processed_count and signal_worker_address are fairly straightforward.

context_switch_count is incremented within SOS_Scheduler::TaskTransition() in three of its cases:

  1. Suspending, the normal case where a worker is about to be switched out.
  2. InstantResuming, where the quantum was exhausted but the runnable queue is empty, so the worker gets another quantum without any switch actually taking place.
  3. SwitchToNonPreemptive, where a preemptively scheduled worker rejoins the cooperative ecosystem.

The return_code property shows up the mechanism by which results of asynchronous calls propagate back to the calling worker. Whoever makes the waiting worker runnable again (typically return of a wait function), the result of the wait is written into this member while the worker remains asleep. After getting back to the runnable queue, and eventually being picked as the next worker to run, SOS_Scheduler::Switch() reads this value and returns it as the return value to the awakened worker. This may propagate through a few layers of function calls, but ultimately it will reach a function that will know what to do with it, e.g. turn a timeout result into an exception.

boost_count is an oddity for dragging a rather useful explanation of priority boosting into the official documentation. Here is my best effort at making sense of this mechanism, whereby a thread waiting on a synchronisation object gets bumped to the head of the runnable queue 1000 times in a row, but then going to the back once before being eligible for a boost again.

The idea of applying a priority boost is a familiar one from OS scheduling. This serves to avoid the priority inversion that can be caused in the below scenario:

  1. Many threads wait for a resource
  2. The low priority thread eventually gets its turn, is assigned ownership and made runnable, while others (including high-priority ones) are waiting in line behind it
  3. Because it has low priority to the scheduler, it doesn’t get scheduled
  4. Now the higher priority threads don’t get to run either, because they are waiting on something that won’t get to run and pass the baton to them

While the boosting mechanism does apply as described, we are glossing over the fact that each scheduler’s “runnable queue” may actually consist of a lot of different queues. The detail has changed between 2014 and 2016, but the omitted bit still boils down to this: Upon becoming runnable, a worker gets a place at the head or the tail of its assigned queue, but this mechanism doesn’t affect what queue it goes into. In the face of workload groups, it might still be possible to craft priority inversion.

DMV data source and iteration mechanism

Good news. This one is a lot more simple and obvious than sys.dm_os_threads, although with a nice twist that made me rethink the object ownership hierarchy.

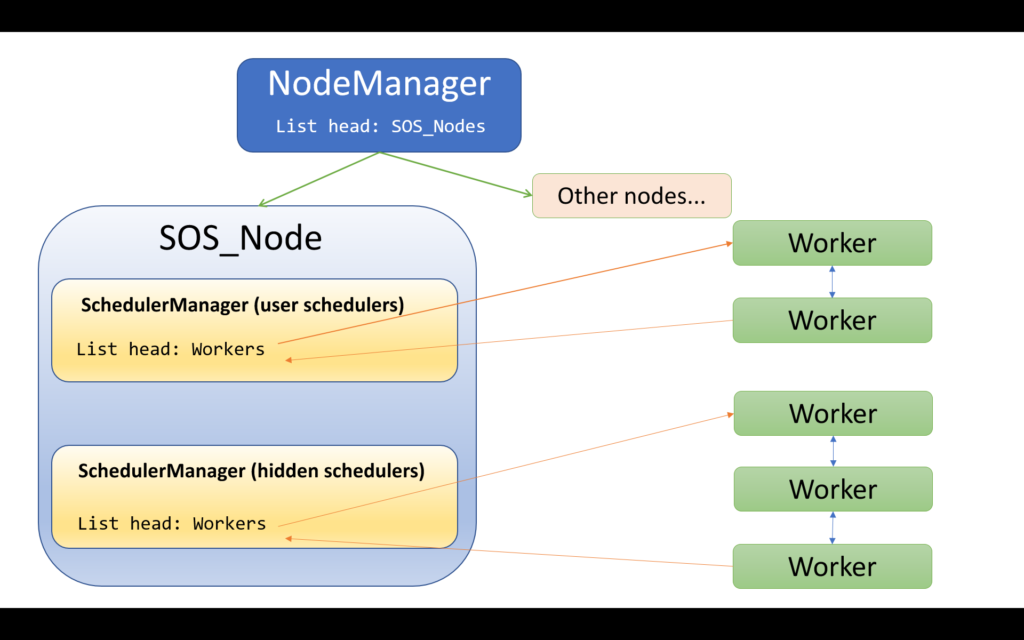
There isn’t a single global list of all Workers, so we start at the root of all things, the singleton NodeManager, to iterate over all SOS_Nodes. Now on a per-node basis, we indirectly find a way to iterate over Workers associated with that node.

It turns out that while workers are associated with schedulers, the relationship works one-way, and schedulers don’t keep lists of their workers, apart from the suspend queues that live within the scheduler (timer lists, IO lists, runnable queues). However,taking one step up in the hierarchy, we do find such a list in the SchedulerManager.

This makes sense when you consider that a worker starts its life being suspended in a SystemThreadDispatcher, which itself lives in a SchedulerManager with a 1:1 relationship between them. The linked list item (right at the start of the Worker object) which enlists it into the SystemThreadDispatcher is the suspend queue entry, and this is the one which moves between different suspend queues, or which belongs to no list at times when the worker is running. There is however a second linked list entry sixteen bytes into the Worker; this one’s list head is in the SchedulerManager.

Each node contains separate SchedulerManagers for normal and hidden schedulers, so the full iteration pattern for the global worker iterator goes like this:

  1. Start with the NodeManager
  2. Iterate over all the SOS_Nodes
  3. Per SOS_Node, first iterate over the workers belonging to its “regular” SchedulerManager
  4. When done with these, now iterate over workers belonging to the “hidden” SchedulerManager

Here is an outline of the involved objects.

The global worker iterator

The mechanism of engaging with a retrieved Worker is less clunky than is the case for dm_os_threads, which requires the target objects to be cloned while locked. Workers have their lifetimes controlled by reference counting, so upon finding the next worker, the reference count on the worker is increased before releasing the list’s spinlock. This avoids the worker getting destroyed while we are querying it. Upon moving to the next worker, the reference count on the previous one is decremented, and – in keeping with the reference-counting contract – if this was the last reference, the worker is then destroyed and its memory deallocated.

Well, there you have it for workers. Who can tell where we’ll go next?

The DMV Diaries: sys.dm_os_threads

Confession. I’ve been intending for ages to do a series on the guts of DMVs. We all use them, I often find answers in their inner workings, and they admirably serve the purpose of surfacing things which would otherwise remain buried.

This isn’t a promise to hammer out one per day, or even one per week, but one has to start somewhere. And since I keep getting seduced by SQLOS threading internals, where better to start than the one listing threads, sys.dm_os_threads?

My reference version here is SQL Server 2016 SP1, although I’ll make one interesting comparison to 2014.

The dm_os_threads data source

Broadly speaking, a DMV presents just another iterator that can be plugged into a query plan. The execution engine calls GetRow() repeatedly until it reaches the end, and the iterator emits rows. The only unusual thing is that the ultimate source of the data may have nothing to do with the storage engine.

Now if you asked me to guess where in the world we’d find a list of all threads to iterate over, I would have expected that we’d start with the NodeManager, iterating over all SOS_Nodes, and then for each of them iterating over its collection of associated SystemThreads. After all, we have a guaranteed 1:1 correspondence between threads and SystemThreads, and I figured that all SystemThreads enlist themselves into a parent SOS_Node upon creation. No-brainer, right?

Turns out that this guess would have been completely wrong, and the reason it would have been a broken implementation will become apparent when we look at the started_by_sqlservr column.

To understand the true data source, we have to take a step back into the formative years of a SQLOS thread. Two reference points:

  • Unsung SQLOS: the SystemThread
  • The early life of a SQLOS thread
  • The MiniSOSThreadResourcesMgr revisited

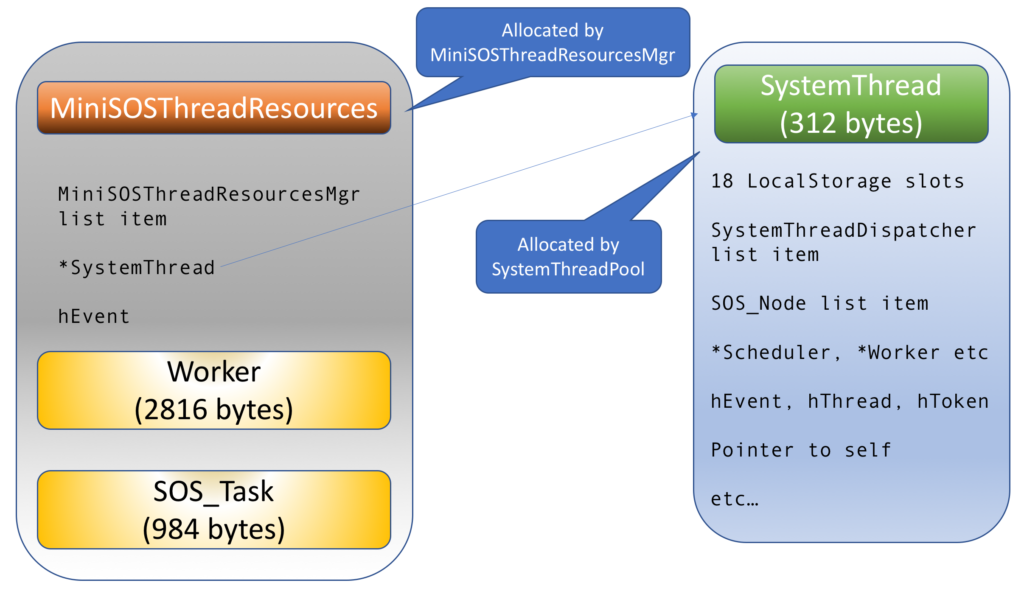
    When a SystemThread gets constructed within the DLLmain thread-attach callback, there are some resources which are so crucial that it’s pointless to continue if they can’t be provided:

    • A memory allocation of 312 bytes to contain the SystemThread object itself
    • The Windows event that will be used in the co-operative context switching mechanism, for which we want a handle ready
    • A memory allocation of 2816 bytes in which we’ll construct a Worker object. Although this thread could eventually be bound to a different Worker, there should be a pool of at least as many Workers as threads.
    • A memory allocation of 984 bytes for an SOS_Task object. For similar reasons, there should be at least one of these floating around per thread.

    The SystemThread allocation itself is handled by the SystemThreadPool, a specialised memory allocator. Because this is stuff that must be in place very early in the boot process, before the SQLOS memory hierarchy is built up, this is one of the few cases where HeapAlloc() is directly invoked.

    The other three are packaged up together in a MiniSOSThreadResources instance, with this neat package being dispensed by the MiniSOSThreadResourcesMgr, another HeapAlloc-happy class.

    These objects don’t live independent lives. Each dispensed MiniSOSThreadResources instance is enlisted in a linked list owned by the MiniSOSThreadResourcesMgr, and contains a pointer to the SystemThread it was created to support. Additionally, the MiniSOSThreadResources instance contains the thread ID (also stored in the SystemThread itself) and a pointer to that thread’s Thread Environment Block (which isn’t).

    Now the creation of a SystemThread, and the association with a MiniSOSThreadResources instance, isn’t something that a programmer has control over, short of removing the thread-attach callback. Whatever reason a thread was created for, and whether or not it plays by SQLOS rules, it will have these accessories if it was created in the SQL Server process. If a thread didn’t start life in the standard entry point function SchedulerManager::ThreadEntryPoint it may not end up enlisted in an SOS_Node, but it sure will be discoverable through the MiniSOSThreadResourcesMgr.

    Here is a fairly simple picture of how these things fit together:

    MiniSOSThreadResources + SystemThread

    The global thread iterator

    You can see where this is heading. When sys.dm_os_threads wants to iterate over all the threads in the process, this global list belonging to the MiniSOSThreadResourcesMgr is the golden data source, since each MiniSOSThreadResources contains a pointer to a SystemThread, and there is a perfect 1:1 correspondence between the two sets of objects.

    The mechanism of iteration serves as a reminder of how to engage hygienically with linked lists, and how the goal of “reasonably accurate and nonblocking” will trump “logically perfect” when it comes to low-level DMVs.

    As a starting point, remember that it isn’t safe to traverse a linked list without exclusively locking it. Now if we wanted to iterate over the members one by one, with an unknown period passing between retrieving items, holding that lock from the first row to the last one is a non-starter, because it could interference in the core workings of SQLOS.

    Instead, here is how things work at high level, leaning on the fact that the list count is stored (“denormalised”) in the list head:

    1. Keep track of how many rows have been produced.
    2. For every GetRow() call, start traversing afresh from the list head.
    3. Every time, go one element further than last time and call that the next item.
    4. Once we have either traversed back around to the list head, or produced the number of rows the list currently claims to contain, we deem it to be the end of the data set.

    Doing it this way may sound wasteful in having to count members from the beginning on every row retrieval – this is what Joe Spolsky dubbed the “Schlemiel the painter” algorithm. However, that small cost comes at the massive benefit of not leaving the structure locked between item retrievals – on each iteration the spinlock is only held up to the point of finding the next target item. Let’s also be clear: not locking it is simply not an option for this source.

    A delightful side effect is of course that we can theoretically skip a member, or read it twice. Those are simply the odds we live with.

    Once the next item (a MiniSOSThreadResources instance) has been found, a “reporting” copy is made of a chunk of its Thread Environment Block and the complete SystemThread. Now everything we need is in those snapshots – or derivable from them – and the risk of inconsistent reads or interference with normal operations is behind us.

    DMV members from the Thread Environment Block

    The following columns in sys.dm_os_threads are served straight from the Thread Environment Block, i.e. user-mode thread state belonging not to SQLOS but to the underlying OS:

    • stack_base_address
    • stack_end_address
    • stack_bytes_committed
    • stack_bytes_used

    Additionally, there are three columns which used to get populated from the TEB in SQL Server 2014, but are now hard-coded to null in 2016. Make of it what you will, but these are ones that were added in later Windows versions and live at higher addresses in the TEB:

    • locale
    • is_impersonating
    • is_waiting_on_loader_lock

    DMV members from the kernel

    Some interesting stuff can only be found out through kernel calls, made using thread handles retrieved through calling OpenThread() using the thread IDs we already have available. Yes, this means that each row retrieved for this DMV involves multiple kernel transitions on Windows, but we’ll have to stay tuned to learn what this really means in SQLPAL.

    From GetThreadTimes() we get the following:

    • creation_time
    • kernel_time
    • usermode_time

    From GetThreadContext() we get instruction_address. Kind of.

    See, for a running thread this isn’t going to be a meaningful answer. And in recognition of that, some clever wag coded up a special case for the current thread, i.e. the one querying the DMV: the hard-coded response coming back is the address of sqldk!SOS_OS::GetThreadControlRegisters(), the function wrapping GetThreadContext().

    Finally, the priority column comes from a straight call to GetThreadPriority(), using the handle we had within the SystemThread all along.

    DMV members from the SystemThread

    The very first one, thread_address, is a “duh” case: it is the address where the actual SystemThread lives. This should of course match self_address which is stored within the SystemThread to support simple checking for an uninitialised of corrupted SystemThread.

    affinity comes straight from the SystemThread, and the related processor_group is derived by reading the full GroupAffinity struct within it. These columns are all straightforward SystemThread members:

    • os_thread_id
    • status – hope to document it some day
    • token
    • fiber_data
    • thread_handle
    • event_handle
    • scheduler_address
    • worker_address
    • fiber_context_address

    Finally, started_by_sqlservr is an interesting piece of derivation. If the list item within the SystemThread, intended to link it into a SOS_Node, is null, we know that the thread didn’t start its life the normal SQLOS way, and hence this column value is derived as false. Otherwise it is true.

    Further reading

    In hunting down evolution of the 64-bit Thread Environment Block layout, I found Geoff Chappell’s excellent reference very helpful. Definitely worth a bookmark.

TSQL Tuesday #93: The buzzword arms race

TSQL2SDAY logo

This month, T-SQL Tuesday, the monthly blog party started by Adam Machanic back in 2009 (!), is hosted by Kendra Little (b | t). Kendra’s choice of topic is Interviewing Patterns & Anti-Patterns, a “soft” subject I’d normally shy away from. But darn it, I’m going to play along for a paltry few paragraphs.

Out of the comfort zone

I guess I’m a classic geek who patiently takes the time to engage with code, but have my blind spots on the soft skills side. Be that as it may, some years ago I had to sit in to help with the technical side of a job interview. I prepared a list of straightforward and not-so-straightforward questions, and felt prepared to push only as hard as was sensible for the candidate, and to let him lead into his own comfort zone if required.

Things started out okay. I asked questions, we embroidered on his answers, and he came across as pretty confident. But I found myself straining to really follow some of his explanations. Not his command of language, but simply whether he was sure what he was talking about.

As I started working harder to parse his explanations, I think it turned into an arms race. Whether by devious design or an unfortunate style of communication, he came into focus as somebody experienced at constructing sentences which sound superficially impressive, while avoiding clear statements. So my manner probably got a bit more aggressive as I tried to poke holes in his answers, and his buzzword emission frequency increased in response.

In the end, I wasn’t convinced by him at all. But I can’t honestly say I would have been able to make a fair comparison between him and someone else by that point. Thing is, I was turned off by the defensive mechanism that didn’t allow him ever to say “I’m not sure” or “Not my area of expertise”, and the slickness of his technique smelled of bull to me.

Maybe that approach is a great survival mechanism for some people, and maybe they only play that overconfidence card in interviews, rather than on the job. Perhaps I handled him really badly – if I played it better, he wouldn’t be on that defensive footing, and he would have come across as a better candidate.

Oh well, it’s back to reading the subtext in source code for me.

In the footsteps of a cooperative wait

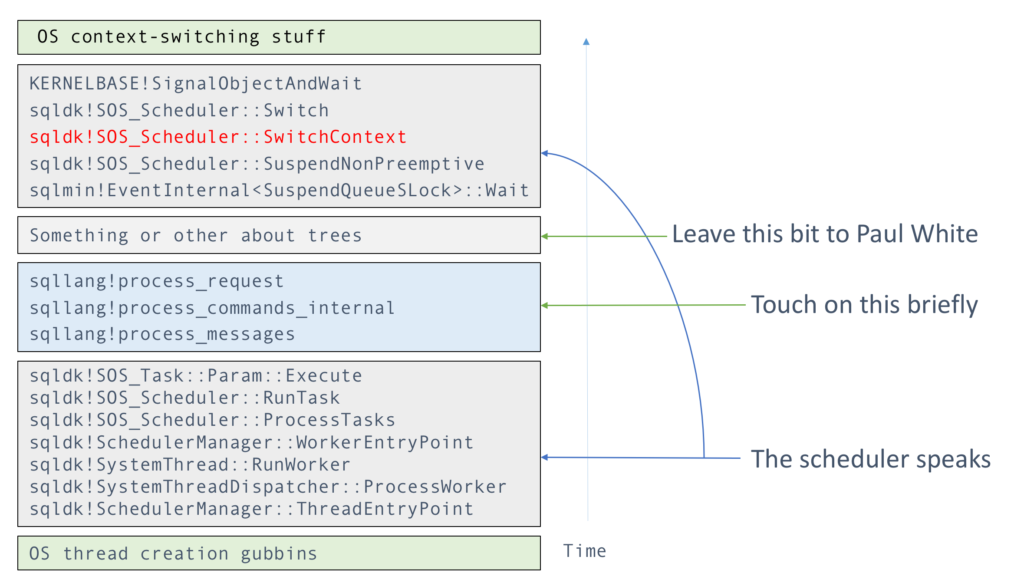
In the last two posts, I gradually climbed up the stack trace of a typical SQLOS thread. Here is such a stack trace from thread creation to context switch, omitting the actual meat of SQL Server so we can focus on the scheduling aspect.

Today I’m looking at the upper part of that map, where the thread was deep in thought, but stepped into the open manhole of a latch wait, which – as is typical for most waits – involves an EventInternal as underlying mechanism.

Slipping into SwitchContext()

The SQLOS scheduler exists in the cracks between user tasks. As we’re well aware, in order for scheduling to happen at all, it is necessary for tasks to run scheduler-friendly code every now and again. In practice this means either calling methods which have the side effect of checking your quantum mileage and yielding if needed, or explicitly yielding yourself when the guilt gets too much.

Now from the viewpoint of the user task, the experience of yielding is no different than the experience of calling any long-running CPU-intensive function: You call a function and it eventually returns. The real difference is that the CPU burned between the call and its return was spent on one or more other threads, while the current thread went lifeless for a bit. But you don’t know that, because you were asleep at the time!

Anyway, for perfectly valid reasons, in the example an EventInternal‘s Wait() method decided to go to sleep, or viewed from a different angle, to put its caller to sleep. We know how that story ends. Ultimately the Wait() call will return, but before then, the thread will snake its way into a cooperative context switch involving SignalObjectAndWait().

The recipe

The EventInternal’s Wait() function is one of a handful of blocking functions that ferry threads into the cooperative context switch – or alternatively you can view it as ferrying the CPU across workers. In SQL Server 2017, you’ll start seeing WaitableBase::Wait(), but this is mostly refactoring, or possibly even un-inlining of existing code phrasing which only now shows up in public symbols.

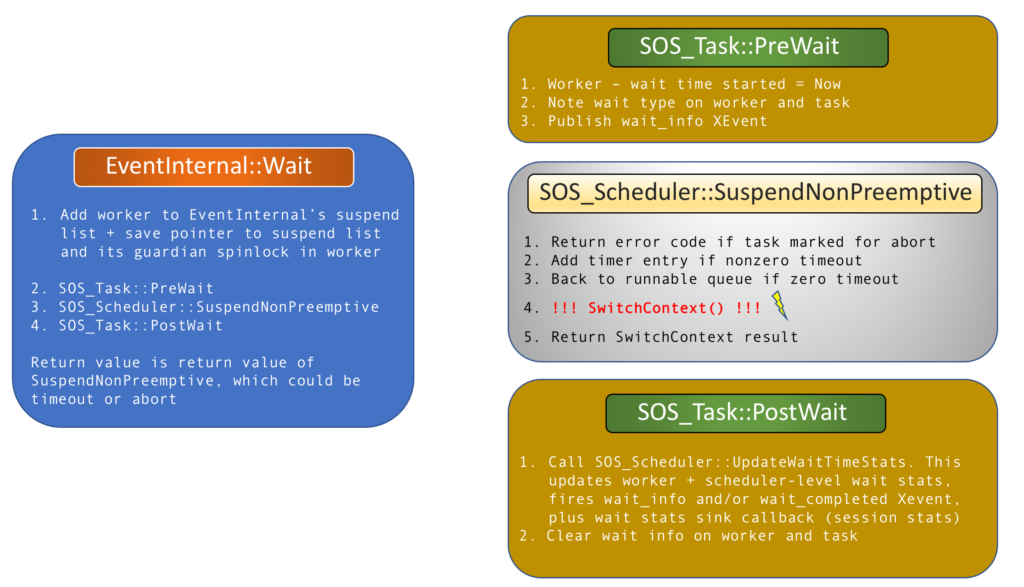
Getting into a context switch and back out again – i.e. eventually having the context switched back to the current thread – in the polite context of a task, includes a sequence of three function calls within Wait():

  1. SOS_Task::PreWait() – this sets up wait accounting and publishes the wait_info XEvent.
  2. SOS_Scheduler::SuspendNonPreemptive() – this sets up timeout logic and does a final check for task abort before calling SwitchContext(). The result of SwitchContext (which is ultimately the result of its call to Switch() will be passed back up to Wait() as the wait result.
  3. SOS_Task::PostWait() – this performs the actual wait accounting and clears the waiting status of the task

These are outlined below:

EventInternal Wait sequence

The elusive SwitchContext() and its uncle Switch()

Okay, I was guilty of a white, or perhaps red, lie by including a call to SwitchContext() in that first diagram. Unless you have a breakpoint on that function, you probably will never see it in a stack trace. This is because it makes a tail call to Switch(), meaning the compiler tranfers control to its child Switch() through a jmp instruction rather than a call, thus erasing and reusing the SwitchContext stack frame. Goto is neither dead nor particularly harmful once you’re into assembly language.

But anyway, there is a nice delineation between the two. Switch() is the lowest-level SQLOS function where a thread may enter and block before eventually returning, and this is where the call to SignalObjectAndWait() happens. As input parameters, it receives a pointer to the current Worker and the one that must be switched to. This includes special handling for the case where the two are the same, e.g. if the worker graciously yielded due to quantum exhaustion, but was the only viable worker on the runnable queue, so got rescheduled immediately. In this case (“InstantResuming” in TaskTransition parlance) there is no mucking about with SignalObjectAndWait, and the function simply returns as soon as it can.

Otherwise, the outgoing worker is tidied up with a TaskTransition call of type “Suspending”, and the long-awaited SignalObjectAndWait ceremony is performed. Next thing it knows, SignalObjectAndWait returns because time passed, other workers ran, and Lady Luck – or if you’re lucky, Father Fairness – chose it as the next worker eligible for a quantum. At this point we get a “Resuming” TaskTransition, and the return value inscribed into the worker by its waker-upper, back when it was put back onto the runnable queue, becomes the return value of Switch() and hence SwitchContext().

However, as a last-ditch guard against against spurious wakeup, should the SignalObjectAndWait call return without the prescribed sacrament of the ambient SystemThread having its LastSignalledBy set by another, we cry foul and go to sleep again using a simple WaitForSingleObject(). As of 2016, there is now even an accompanying premature_systemthread_wakeup XEvent to herald the outrage.

Working backwards then, what does SwitchContext() do? Simple. This is where all the scheduler chores (e.g. checking timer and I/O lists) happen, and crucially, where the next incoming worker is chosen from the runnable queue. Its special case is finding an empty runnable queue, at which point the scheduler’s idle worker is scheduled, which may eventually go to sleep through WaitForSingleObject() on the scheduler’s own idle event. At this point the whole scheduler would be asleep, and it will require another scheduler to wake it up by signalling that idle event.

My, how the runnable queue has grown up. You may have gathered from Bob Dorr’s 2016 updated scheduling algorithms post that the PercentileQueue used in 2012 and 2014 got replaced with something else. What we have in 2016 (and AFAIK in 2017) is the continued use of said PercentileQueue for system schedulers, but the new GroupWorkerQueue for normal ones. This is a thing of beauty, containing a linked list per resource group per scheduler, i.e. partitioned in such a way that little in the way of locking is needed. I would like to highlight that its use doesn’t affect the awarded quantum target, which remains at 4ms, but only which worker gets chosen. One day I might have enough meat to write a whole post about it…

Final thoughts

This touches upon something I scratched at in The Myth of the Waiter List, which can always do with being aired again.

For the most part, a wait list, aka suspend queue, is something that belongs to a synchronisation resource like a latch or a a reader-writer lock. Apart from the timer and I/O lists, and the work dispatcher, suspend queues have nothing to do with schedulers: the synchronisation objects that own those suspend queues will move a worker from them to the relevant scheduler’s runnable queue when its time is up. The scheduler really only cares about the runnable queue, and will not waste tears or time worrying about workers suspended on synchronisation objects.

It should be clear from the context, but I have completely ignored fiber mode today. A fiber switch is a different beast entirely, and you can read more about it in The Joy of Fiber Mode.

Yes, there is some repetition from earlier posts, but I hope that covering the same ground multiple times in different ways works as well for you as it does for me. Any questions or observations? I’m all ears.